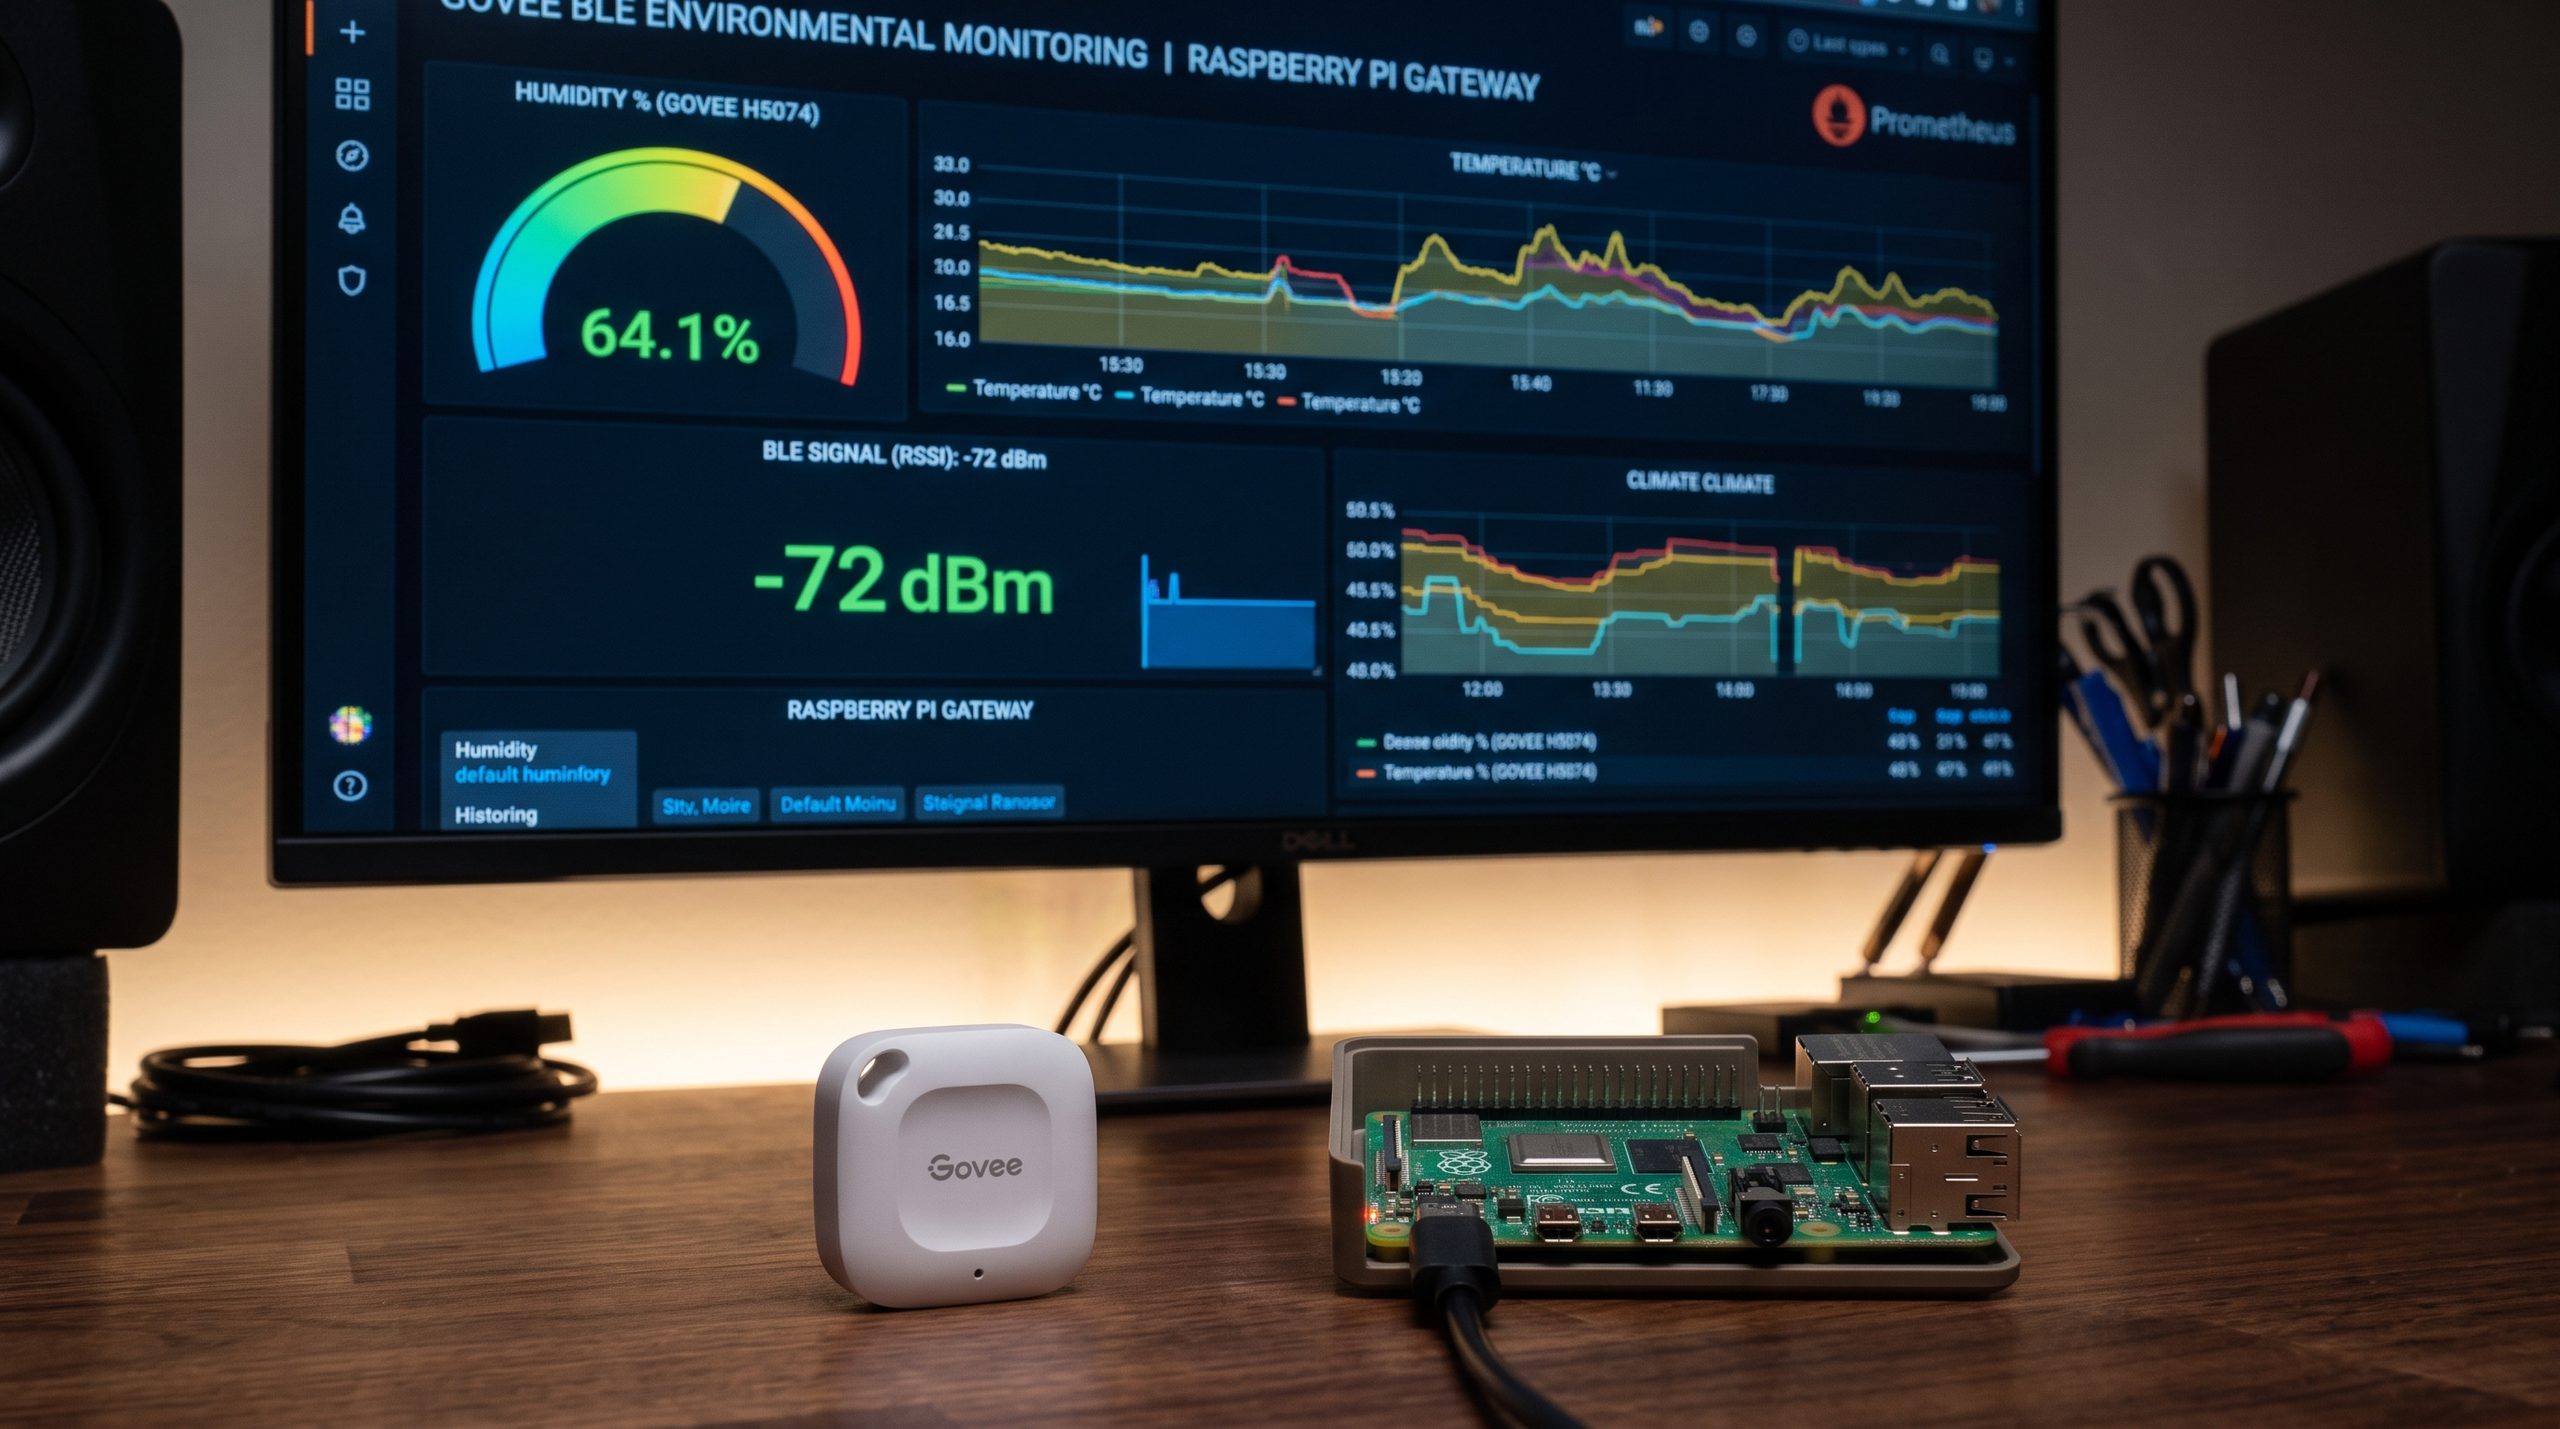
I have been using three Govee H5074 hygrometers to watch my humidors. They are small, cheap and accurate enough for the job. The Govee Home app does its part as well.. but only while my phone is within Bluetooth range. The moment I leave home, I am blind.
The official cure is a Govee WiFi gateway. Unfortunately, I could not find a suitable single gateway to purchase. The ones on sale come bundled with other sensor models, and I could not find any confirmation that they would accept my H5074s at all. That is when I looked at my beloved Raspberry Pi 3B+, which sits 1 m away from the humidors and was running nothing but Pi-hole and a withings-sync job.
Three weeks ago I sat down for a half-day long Saturday session, and we built the whole chain. This post documents every step that survived that day, including the places where we stumbled. I assume you already have a Prometheus and Grafana server reachable over HTTPS, with nginx in front. I will call it metrics.example.com here, so replace that with your own hostname.
I suspect an official gateway would have cost less than the hours I spent. Still, the readings now live in my own Grafana with my own alert rules, and nothing depends on somebody else’s cloud (we ‘hackers’ love it!).
The Idea
The H5074 is a Bluetooth Low Energy device. It broadcasts temperature, humidity and battery level in the open, with no pairing and no Govee account needed. Anything with a BLE radio can listen, and the Govee app keeps working in parallel.
I ended up with a rather short chain:
- The three sensors broadcast their readings over BLE.
- A small Python exporter on the Pi decodes them and serves the values on port
9741. - vmagent on the Pi scrapes the exporter and pushes the samples to my server over HTTPS.
- Prometheus stores the samples, Grafana draws them and evaluates the alert rules.
- Telegram and ntfy.sh deliver the alerts to my phone.
I based this design on two details. The H5074 puts its payload in the scan response and not in the plain advertisement, so the listener has to do ACTIVE scanning. A passive listener sees the device but never the readings.
Prometheus is pull-based, and that was the second detail. My Pi sits behind NAT at home, so it can reach the internet but nobody can reach it from outside. The Pi has to push, and that is exactly what vmagent does with remote write.
Step 1: Check That the Pi Hears the Sensors
First make sure the sensors are visible from where the Pi sits. Nothing else matters if this one fails.
pi@pi3b:~ $ sudo hcitool lescan --duplicates | grep Govee
A4:C1:38:XX:XX:XX Govee_H5074_6EE7
A4:C1:38:XX:XX:XX Govee_H5074_6EEA
A4:C1:38:XX:XX:XX Govee_H5074_6EE7
A4:C1:38:XX:XX:XX Govee_H5074_6EC2
A4:C1:38:XX:XX:XX Govee_H5074_6EEA
A4:C1:38:XX:XX:XX Govee_H5074_6EC2
I was quite happy to see all three there. Each sensor names itself with the model number and the last four characters of its MAC address. The Govee Home app shows the MAC of every unit under device settings, so matching a name to a physical humidor takes a minute.
I keep my Pi on ethernet, and for a reason. The Pi 3 shares one antenna between WiFi and Bluetooth. With the Pi on WiFi, a continuous scan and the DNS traffic of Pi-hole would compete for the same radio.
Step 2: Install the Exporter
Create a Python virtual environment and install the three libraries:
sudo apt install -y python3-venv
python3 -m venv ~/govee
~/govee/bin/pip install bleak TheengsDecoder prometheus_client
I rely on bleak for the scanning, TheengsDecoder for the decoding and prometheus_client for the metrics endpoint. I preferred to delegate the decoding to Theengs on purpose. The byte layout is maintained upstream, so the next firmware quirk is somebody else’s problem and not mine.
Save the script below as /home/pi/govee_exporter.py:
#!/usr/bin/env python3
"""
Govee H5074 -> Prometheus exporter.

Listens for BLE advertisements from Govee H5074 thermo-hygrometers and
exposes temperature, humidity, battery and RSSI on a Prometheus endpoint.

The H5074 puts its payload in the SCAN RESPONSE, not the plain advertisement,
so active scanning is mandatory. bleak scans actively by default; the
scanning_mode argument below makes that explicit so nobody "optimises" it
to passive later.

Decoding is delegated to TheengsDecoder so the byte layout is maintained
upstream rather than hardcoded here.

Dependencies:
    pip install bleak TheengsDecoder prometheus_client
"""

from __future__ import annotations
import asyncio
import json
import logging
import os
import time

from bleak import BleakScanner
from prometheus_client import Gauge, start_http_server
from TheengsDecoder import decodeBLE

# --- configuration ---------------------------------------------------------

PORT = int(os.environ.get("GOVEE_EXPORTER_PORT", "9741"))
NAME_PREFIX = os.environ.get("GOVEE_NAME_PREFIX", "Govee_H5074")
LOG_LEVEL = os.environ.get("GOVEE_LOG_LEVEL", "INFO")

# BlueZ scanning can silently stall after long uptimes. Tear the scanner
# down and rebuild it periodically rather than discovering this during an
# alert that never fired.
SCAN_CYCLE_SECONDS = int(os.environ.get("GOVEE_SCAN_CYCLE", "900"))

# The scan cycle above cannot rescue a scan that never starts. When the adapter is powered
# off while StartDiscovery is still pending, BlueZ 5.55 drops the call without replying and
# bleak waits for that reply forever, so the loop never comes round again and the process
# looks healthy to systemd. If no advertisement from any device arrives for this long, exit
# and let systemd (Restart=always) start a fresh process - the one recovery known to work.
STALL_SECONDS = int(os.environ.get("GOVEE_STALL_SECONDS", "120"))

# --- metrics ---------------------------------------------------------------

LABELS = ["mac", "sensor"]

TEMPERATURE = Gauge("govee_temperature_celsius", "Temperature in Celsius", LABELS)
HUMIDITY = Gauge("govee_humidity_percent", "Relative humidity in percent", LABELS)
BATTERY = Gauge("govee_battery_percent", "Battery level in percent", LABELS)
RSSI = Gauge("govee_rssi_dbm", "Received signal strength in dBm", LABELS)
LAST_SEEN = Gauge(
    "govee_last_seen_timestamp_seconds",
    "Unix timestamp of the last successfully decoded advertisement",
    LABELS,
)
DECODE_FAILURES = Gauge(
    "govee_decode_failures_total",
    "Advertisements matching the name prefix that the decoder could not parse",
    LABELS,
)

_decode_failures: dict[str, int] = {}

# Monotonic time of the last advertisement from any BLE device, Govee or not: it tracks
# whether the scan is alive, not whether the sensors are.
_last_advertisement = time.monotonic()

log = logging.getLogger("govee_exporter")


# --- decoding --------------------------------------------------------------


def build_decoder_input(device, adv) -> str | None:
    """Reassemble bleak's split manufacturer data into what Theengs expects.

    bleak hands back manufacturer_data as {company_id: payload_bytes}, having
    already stripped the two-byte company identifier. TheengsDecoder wants the
    full AD field: company id little-endian, then the payload.
    """
    if not adv.manufacturer_data:
        return None

    company_id, payload = next(iter(adv.manufacturer_data.items()))
    manufacturer_data = company_id.to_bytes(2, "little").hex() + payload.hex()

    return json.dumps(
        {
            "name": adv.local_name or "",
            "id": device.address,
            "rssi": adv.rssi,
            "manufacturerdata": manufacturer_data,
        }
    )


def detection_callback(device, adv) -> None:
    global _last_advertisement
    _last_advertisement = time.monotonic()

    name = adv.local_name or ""
    if not name.startswith(NAME_PREFIX):
        return

    mac = device.address
    labels = {"mac": mac, "sensor": name}

    encoded = build_decoder_input(device, adv)
    if encoded is None:
        # Name-only frame. The H5074 emits several frame types; this is normal
        # and not an error.
        log.debug("%s: advertisement carried no manufacturer data", mac)
        return

    decoded = decodeBLE(encoded)
    if not decoded:
        _decode_failures[mac] = _decode_failures.get(mac, 0) + 1
        DECODE_FAILURES.labels(**labels).set(_decode_failures[mac])
        log.warning("%s: decoder returned nothing for %s", mac, encoded)
        return

    data = json.loads(decoded)
    log.debug("%s: decoded %s", mac, data)

    # Field names come from the Theengs device definition. Verify them against
    # your first decoded payload (run with GOVEE_LOG_LEVEL=DEBUG) rather than
    # trusting this list, since they can change between decoder releases.
    if "tempc" in data:
        TEMPERATURE.labels(**labels).set(float(data["tempc"]))
    if "hum" in data:
        HUMIDITY.labels(**labels).set(float(data["hum"]))
    if "batt" in data:
        BATTERY.labels(**labels).set(float(data["batt"]))

    RSSI.labels(**labels).set(adv.rssi)
    LAST_SEEN.labels(**labels).set(time.time())


# --- main ------------------------------------------------------------------


async def scan_forever() -> None:
    while True:
        log.info("starting active scan cycle (%ss)", SCAN_CYCLE_SECONDS)
        try:
            async with BleakScanner(
                detection_callback=detection_callback,
                scanning_mode="active",
            ):
                await asyncio.sleep(SCAN_CYCLE_SECONDS)
        except Exception:
            log.exception("scanner failed, retrying in 10s")
            await asyncio.sleep(10)


async def exit_when_stalled() -> None:
    while True:
        await asyncio.sleep(10)
        silent = time.monotonic() - _last_advertisement
        if silent > STALL_SECONDS:
            log.error(
                "no BLE advertisement for %.0fs, the scan is dead; exiting so systemd restarts it",
                silent,
            )
            logging.shutdown()
            # Not sys.exit(): unwinding would have to cancel the very await that is hung.
            os._exit(1)


async def run() -> None:
    await asyncio.gather(scan_forever(), exit_when_stalled())


def main() -> None:
    logging.basicConfig(
        level=getattr(logging, LOG_LEVEL.upper(), logging.INFO),
        format="%(asctime)s %(levelname)s %(name)s %(message)s",
    )
    start_http_server(PORT)
    log.info("metrics on :%d/metrics, matching name prefix %r", PORT, NAME_PREFIX)
    asyncio.run(run())


if __name__ == "__main__":
    main()
I kept the script small, but it has a few opinions. It asks for active scanning explicitly, so nobody “optimises” it to passive later. It also tears the scanner down and rebuilds it every 15 minutes, because BlueZ scanning can stall silently after long uptimes. The stall watchdog is a later addition, and Step 14 tells that story.
Step 3: First Run in Debug Mode
I ran it by hand first, to watch what the decoder returns:
sudo GOVEE_LOG_LEVEL=DEBUG ~/govee/bin/python ~/govee_exporter.pyI hit an error on the very first try. The original version did not have the from __future__ import annotations line, and it died immediately:
    def build_decoder_input(device, adv) -> str | None:
TypeError: unsupported operand type(s) for |: 'type' and 'NoneType'
I checked, and Raspberry Pi OS Bullseye ships Python 3.9. The str | None syntax in annotations needs 3.10 or newer. That single import defers the evaluation, and that sorted out the problem. Check your version with python3 -V if you are on an older image as well.
I let the script run for a few minutes and read the decoded lines. The field names tempc, hum and batt come from the Theengs device definition, and they can change between decoder releases. If they do not match, the gauges silently stay empty, so it is really better to look once.
Then ask the endpoint from a second terminal:
pi@pi3b:~ $ curl -s localhost:9741/metrics | grep -E 'govee_(temperature|humidity|battery|rssi)'
# HELP govee_temperature_celsius Temperature in Celsius
# TYPE govee_temperature_celsius gauge
govee_temperature_celsius{mac="A4:C1:38:XX:XX:XX",sensor="Govee_H5074_6EC2"} 22.01
govee_temperature_celsius{mac="A4:C1:38:XX:XX:XX",sensor="Govee_H5074_6EE7"} 22.3
govee_temperature_celsius{mac="A4:C1:38:XX:XX:XX",sensor="Govee_H5074_6EEA"} 22.18
# HELP govee_humidity_percent Relative humidity in percent
# TYPE govee_humidity_percent gauge
govee_humidity_percent{mac="A4:C1:38:XX:XX:XX",sensor="Govee_H5074_6EC2"} 62.31
govee_humidity_percent{mac="A4:C1:38:XX:XX:XX",sensor="Govee_H5074_6EE7"} 62.66
govee_humidity_percent{mac="A4:C1:38:XX:XX:XX",sensor="Govee_H5074_6EEA"} 60.13
# HELP govee_battery_percent Battery level in percent
# TYPE govee_battery_percent gauge
govee_battery_percent{mac="A4:C1:38:XX:XX:XX",sensor="Govee_H5074_6EC2"} 100.0
govee_battery_percent{mac="A4:C1:38:XX:XX:XX",sensor="Govee_H5074_6EE7"} 100.0
govee_battery_percent{mac="A4:C1:38:XX:XX:XX",sensor="Govee_H5074_6EEA"} 100.0
# HELP govee_rssi_dbm Received signal strength in dBm
# TYPE govee_rssi_dbm gauge
govee_rssi_dbm{mac="A4:C1:38:XX:XX:XX",sensor="Govee_H5074_6EC2"} -56.0
govee_rssi_dbm{mac="A4:C1:38:XX:XX:XX",sensor="Govee_H5074_6EE7"} -55.0
govee_rssi_dbm{mac="A4:C1:38:XX:XX:XX",sensor="Govee_H5074_6EEA"} -50.0
I got all four metrics for all three sensors. The signal levels between -50 and -56 dBm are very strong, and anything better than about -85 is fine. The three units agreeing within 0.3 °C and 2.5 points of humidity was a nice sanity check as well.
Step 4: Run It as a Service
Create file /etc/systemd/system/govee-exporter.service:
[Unit]
Description=Govee H5074 BLE Prometheus exporter
After=bluetooth.target
Requires=bluetooth.target

[Service]
User=pi
ExecStart=/home/pi/govee/bin/python /home/pi/govee_exporter.py
Restart=always
RestartSec=10
Environment=GOVEE_LOG_LEVEL=INFO

[Install]
WantedBy=multi-user.target
Then enable and start it:
sudo systemctl daemon-reload
sudo systemctl enable --now govee-exporter
I used sudo for the manual run only as a shortcut. The service runs as the plain pi user and that proved to be enough, since bleak talks to BlueZ over D-Bus. No root is needed for the permanent setup.
Step 5: Open a Write Endpoint on the Server
Prometheus refuses remote write by default. My server already had Prometheus listening on 127.0.0.1:9090 and nginx terminating TLS, so three small additions were enough.
I added this flag to the Prometheus command line and restarted it. Without the flag the Pi only gets 404 answers.
--web.enable-remote-write-receiverI created a credential for the Pi next. The write path is internet-facing, and an open write endpoint means anyone can inject garbage into your metrics or fill your disk.
sudo apt install -y apache2-utils
sudo htpasswd -c /etc/nginx/.htpasswd-write vmagent
Then add a rate limit zone into the http block of /etc/nginx/nginx.conf:
limit_req_zone $binary_remote_addr zone=write:10m rate=60r/m;and a dedicated location into your HTTPS server block:
location /api/v1/write {
    auth_basic "metrics write";
    auth_basic_user_file /etc/nginx/.htpasswd-write;
    limit_req zone=write burst=30 nodelay;

    proxy_pass http://127.0.0.1:9090/api/v1/write;
    proxy_set_header Host $host;
    client_max_body_size 32m;
}
sudo nginx -t && sudo systemctl reload nginxI test the endpoint from the Pi with an empty POST before going any further:
curl -u vmagent -i https://metrics.example.com/api/v1/write -X POST --data ''You want a 400 here, strange as it sounds. It means the authentication passed and Prometheus rejected the empty body. A 401 is a wrong password, and a 404 is the missing receiver flag.
I would check the retention while on the server as well. The Prometheus default is 15 days, which is a bit useless for something as slow as a humidor.
Step 6: Install vmagent on the Pi
First find out which build you need:
uname -mI got aarch64, which means the arm64 build. An answer of armv7l means the arm build. My Pi is a funny one though, with a 64-bit kernel under a 32-bit userland. The arm64 build still runs fine there, since vmagent is a single static binary.
vmagent ships inside the vmutils archive and not as a standalone download:
ARCH=arm64     # or: ARCH=arm
VM_VER=$(curl -s https://api.github.com/repos/VictoriaMetrics/VictoriaMetrics/releases/latest | grep -Po '"tag_name": "\K[^"]*')
echo $VM_VER

cd /tmp
curl -LO https://github.com/VictoriaMetrics/VictoriaMetrics/releases/download/${VM_VER}/vmutils-linux-${ARCH}-${VM_VER}.tar.gz
tar xzf vmutils-linux-${ARCH}-${VM_VER}.tar.gz
sudo install -m 0755 vmagent-prod /usr/local/bin/vmagent
vmagent --version
Create a system user, the directories and the password file:
sudo useradd --system --no-create-home --shell /usr/sbin/nologin vmagent
sudo mkdir -p /etc/vmagent /var/lib/vmagent
sudo chown vmagent:vmagent /var/lib/vmagent

sudo vi /etc/vmagent/write-password
sudo chown vmagent:vmagent /etc/vmagent/write-password
sudo chmod 600 /etc/vmagent/write-password
I keep the password in a file and not on the command line. The command line lands in ps output and in a unit file that anyone on the box can read. The file holds a single line, the password you gave to htpasswd on the server.
Create file /etc/vmagent/scrape.yml:
global:
  scrape_interval: 60s
  external_labels:
    source: pi3b

scrape_configs:
  - job_name: govee
    static_configs:
      - targets: ["127.0.0.1:9741"]
I added the external_labels block to tag everything this agent sends, and I really recommend having it from day one. The moment you add a second collector, you will know where a series came from without guessing.
Create file /etc/systemd/system/vmagent.service:
[Unit]
Description=vmagent - scrapes local exporters and remote-writes to Prometheus
After=network-online.target
Wants=network-online.target

[Service]
User=vmagent
Group=vmagent
ExecStart=/usr/local/bin/vmagent \
  -promscrape.config=/etc/vmagent/scrape.yml \
  -remoteWrite.url=https://metrics.example.com/api/v1/write \
  -remoteWrite.basicAuth.username=vmagent \
  -remoteWrite.basicAuth.passwordFile=/etc/vmagent/write-password \
  -remoteWrite.tmpDataPath=/var/lib/vmagent \
  -remoteWrite.maxDiskUsagePerURL=512MB \
  -remoteWrite.forceVMProto=false \
  -httpListenAddr=127.0.0.1:8429
Restart=always
RestartSec=10
NoNewPrivileges=true
ProtectSystem=strict
ProtectHome=true
PrivateTmp=true
ReadWritePaths=/var/lib/vmagent

[Install]
WantedBy=multi-user.target
sudo systemctl daemon-reload
sudo systemctl enable --now vmagentI want to spend a word on two flags. -remoteWrite.tmpDataPath makes vmagent buffer on disk while the server is unreachable and replay when it is back, so an internet drop at home leaves no hole in the history. -remoteWrite.maxDiskUsagePerURL caps that buffer. A full SD card on a Pi-hole means no DNS for the whole house, and I did NOT want to learn that the hard way.
Step 7: Verify, and Two Things That Bit Me
Give it a minute first, since there is nothing to push before the first scrape. Then look at the agent’s own counters:
pi@pi3b:/tmp $ curl -s localhost:8429/metrics | grep vmagent_remotewrite_requests_total
vmagent_remotewrite_requests_total{url="1:secret-url", status_code="2XX"} 25
vmagent_remotewrite_requests_total{url="1:secret-url", status_code="400"} 2
vmagent_remotewrite_requests_total{url="1:secret-url", status_code="415"} 22
vmagent_remotewrite_requests_total{url="1:secret-url", status_code="503"} 9
You are looking for a climbing 2XX counter, that is the finish line. My first attempt was not that clean though, as you can see above.
I traced the 503 answers to nginx and not to Prometheus. My first rate limit was rate=10r/m with burst=5, sized for one request per minute. By then vmagent had a backlog to replay, and it ran straight into the limiter:
[error] 4504#4504: *16 limiting requests, excess: 5.356 by zone "write", client: ..., request: "POST /api/v1/write HTTP/1.1"That is why Step 5 already carries rate=60r/m and burst=30 nodelay. The nodelay part matters a lot. Without it nginx queues the excess requests, and the timeouts of vmagent start to fire.
The 415 answers are a protocol negotiation. vmagent tries the VictoriaMetrics wire format first, Prometheus rejects it, and vmagent falls back to the standard Prometheus remote write. I pinned the protocol with -remoteWrite.forceVMProto=false, which is already in the unit file above. I still see some 415s right after each restart, and they are harmless.
Flag names move between VictoriaMetrics releases. Check yours with vmagent -help 2>&1 | grep -i proto before copying mine.
Finally open Grafana, go to Explore and query govee_humidity_percent. Three series carrying source="pi3b" mean the plumbing is complete.
Step 8: Build the Dashboard
I built a dashboard called Humidors. The top row has one stat panel per humidor with humidity, temperature and battery level. Below that come the humidity graphs, the temperatures and a battery graph at the very bottom.

I named the panels in Turkish, so here is a tiny dictionary. Nem is humidity, Sıcaklık is temperature and Pil is battery.
I do not treat these little sensors as lab instruments. Each of my queries carries a small correction per sensor (the Govee units would need a calibration for +-3 for humidity – this was done through a 24hr damp salt test in a closed jar), for instance:
govee_humidity_percent{sensor="Govee_H5074_6EE7"} + 2.5I added two more panels that show the variance over a sliding window of one hour:
stdvar_over_time(govee_humidity_percent{sensor="Govee_H5074_6EE7"}[1h])I read a flat line there as a stable humidor. A spike usually means that somebody opened the lid.

Step 9: Telegram Contact Point
I preferred the built-in Grafana alerting to Alertmanager for this job. It has native Telegram support and it needs no extra daemon, which is plenty for three sensors.
Create the bot first. Message @BotFather in Telegram, send /newbot and follow the prompts. It hands you a token, and that token is full control of the bot, so keep it secret.
I sent a message to my new bot and then read the chat ID from the API:
curl -s "https://api.telegram.org/bot<TOKEN>/getUpdates" | python3 -m json.toolYou will find "chat": {"id": ...} in the output. The bot cannot start a conversation by itself, so that first message from your side is mandatory.
I added the contact point in Grafana under Alerting, Contact points, with the Telegram integration. Paste the token and the chat ID there, and use the Test button before saving.

Step 10: ntfy.sh as a Second Channel
I wanted a second, independent path to my phone at no cost. ntfy.sh is very close to purpose-built for this. You publish to a topic with an HTTP POST, subscribe to the same topic in the phone app, and the push arrives. No account, no token.
The topic name is the ONLY secret on the public server. Anyone who knows it can read your alerts, so generate something unguessable:
openssl rand -hex 16Install the ntfy app on the phone, subscribe to that topic and test it from any shell:
curl -d "test from monitoring" https://ntfy.sh/<your-topic>I added another contact point in Grafana, this time with the Webhook integration and the POST method. My first notifications were an unreadable blob of JSON. The Message field of Grafana only sets the message key inside its own JSON payload, and ntfy rendered the whole payload as text.
ntfy has message templating for exactly this case. You pass a small template in the URL, and ntfy fills it from the JSON body it receives. So the webhook URL becomes:
https://ntfy.sh/<your-topic>?tpl=yes&m=%7B%7B.message%7D%7D&t=%7B%7B.title%7D%7D%7B%7B and %7D%7D are just {{ and }} in URL encoding. Under the optional webhook settings I set the Title field to:
{{ .Status }} — {{ .CommonLabels.alertname }}and the Message field to:
{{ template "ntfy.message" . }}That last line refers to a notification template. Create one named ntfy with this content:
{{ define "ntfy.message" }}
{{- range .Alerts -}}
{{ .Labels.alertname }}: {{ .Annotations.summary }}
{{ end -}}
{{ end }}
I kept the template generic on purpose. Each alert rule writes its own wording into a summary annotation, and the template only assembles them.

Step 11: Alert Rules
I created nine rules in total, three per humidor. One fires when the humidity leaves its band, one when the temperature leaves its band and one when the battery runs low. They all look alike, so I will describe just one.

The query of the first humidity rule is:
govee_humidity_percent{sensor="Govee_H5074_6EE7"} + 2.5I set the condition as a threshold, IS OUTSIDE RANGE 67 TO 72 (This specific range is my preferred range for Cubans). The temperature rules use 21 to 24 °C, and the battery rules fire below 10%. The whole group is evaluated every minute.
The pending period is the setting that matters most. On the first evening I got a resolved at 20:05 and a new firing at 20:07, for the same humidor. A humidor that is out of band for two minutes is noise. Out of band for half an hour is a drift worth knowing about, so all my rules now wait 30 minutes.
I write the wording of each notification into the Summary annotation of the rule. Mine are in Turkish, and in English it would be:
{{ with $values.A }}{{ printf "%.1f" .Value }}{{ else }}no data{{ end }}% — out of rangeI added the printf because the raw value arrives as 65.28999999999999, which is rather ugly on a phone screen. The with guard is there for the day a sensor goes silent. Without it the notification reads %!f(<nil>), which is even uglier.
Unfortunately, the default Grafana notification is quite a wall of text, with every label, a source link and a silence link. I just wanted the alert name and the value. The summary annotation, together with the small template from Step 10, gave me exactly that.

Step 12: Route the Alerts
I route by labels. Each rule carries one label per channel, for instance ntfy.sh = yes, and the notification policy has one child policy per label that points to the matching contact point. Every child has “Continue matching subsequent sibling nodes” switched on, so a single alert reaches both Telegram and ntfy.

The default policy points to an empty contact point. A rule without a channel label therefore notifies nobody, and adding a channel to a rule is just one more label.
Step 13: Watch the Watcher
I run all of this alerting on the server. If the server dies, nothing tells me so, and that includes the alert that would say something is wrong. I closed that hole with healthchecks.io, which does the opposite job. It expects a ping every few minutes and mails me when the pings stop.
Create a check there, then add this line to the crontab of root on the server:
*/5 * * * * curl -fsS -m 10 --retry 3 https://hc-ping.com/<your-uuid> > /dev/nullI have to say healthchecks.io is really c00l. It does exactly one thing and it does not try to be a platform.
Step 14: Make It Survive a Reboot
After three weeks the chain had one weak spot, and I found it while preparing this post. The Pi had rebooted, the exporter was running, systemd was happy.. and not a single reading arrived for about two and a half hours. All nine alert rules went to NoData.
The cause is a helper in Raspberry Pi OS. bthelper from the pi-bluetooth package switches the Bluetooth adapter off and on again, about five seconds after the adapter appears at boot. My exporter had started its scan right inside that window. BlueZ 5.55 dropped the request without any reply, and bleak kept waiting for that reply forever.
I fixed it from two sides. The script got a small watchdog, which is already in the listing of Step 2. If no advertisement from ANY Bluetooth device arrives for two minutes, the process exits and systemd starts a fresh one. In my test with a power cycle of the adapter, the exporter recovered by itself in 133 seconds.
I did not want the exporter to start too early either. Create file /etc/systemd/system/govee-exporter.service.d/10-wait-adapter.conf:
# At boot bluetooth.target is reached while bluetooth.service is still being skipped (hciuart
# attaches the UART chip only at ~23 s), and once hci0 appears bthelper@hci0 power-cycles it
# 5 s later. A scan started before that power cycle dies silently, so govee-wait-adapter blocks
# until bthelper is done and bluetoothd has powered hci0 (details in the script).
[Unit]
After=hciuart.service bluetooth.service bthelper@hci0.service
Wants=bluetooth.service
# A bluetoothd restart kills the scan the same silent way: restart together with it.
PartOf=bluetooth.service

[Service]
ExecStartPre=/usr/local/bin/govee-wait-adapter 90
TimeoutStartSec=120
and the helper it calls, /usr/local/bin/govee-wait-adapter:
#!/bin/sh
# govee-wait-adapter [SECONDS] - ExecStartPre for govee-exporter.service.
# Block until it is safe to start a BLE scan on hci0:
#   1. bthelper@hci0.service has finished power-cycling the adapter, and
#   2. bluetoothd is up and has powered hci0.
# pi-bluetooth's /usr/bin/bthelper ends with `(sleep 5; bluetoothctl power off; bluetoothctl
# power on) &`: it power-cycles hci0 ~5 s after the adapter appears, from a subshell that
# outlives the oneshot's ExecStart but stays in the unit's cgroup. A scan caught by that
# power-off is lost without any error. If StartDiscovery had already returned, discovery just
# stops (Discovering=false, stale govee_* until the next 900 s scan cycle); if it was still
# pending, BlueZ 5.55 drops the call without replying and bleak waits forever (Oct 11 2026:
# 2.5 h without data after a reboot). A fixed settle delay cannot fix this, it only moves the
# scan start around inside those 5 s - so wait for the helper's cgroup to empty instead.
# bluetooth.service is checked before talking to org.bluez because any D-Bus call to it
# auto-starts the service (busctl 247 ignores --auto-start=no for get-property), and before
# hciuart has attached the UART chip (~23 s into boot) that start is just skipped by its
# ConditionPathIsDirectory.
limit=${1:-90}
helper=bthelper@hci0.service

helper_pending() {
    case $(systemctl is-active "$helper") in
        activating) return 0 ;;
        active) ;;
        *) return 1 ;; # inactive, failed or not installed: no power cycle is coming
    esac
    cg=$(systemctl show -p ControlGroup --value "$helper")
    [ -n "$cg" ] && grep -qx 'populated 1' "/sys/fs/cgroup$cg/cgroup.events" 2>/dev/null
}

hci0_powered() {
    [ "$(systemctl is-active bluetooth.service)" = active ] &&
        busctl --system get-property org.bluez /org/bluez/hci0 org.bluez.Adapter1 Powered \
            2>/dev/null | grep -qx 'b true'
}

i=0
while [ "$i" -lt "$limit" ]; do
    if ! helper_pending && hci0_powered; then
        [ "$i" -gt 0 ] && echo "bthelper done and hci0 powered after ${i}s"
        exit 0
    fi
    i=$((i + 1))
    sleep 1
done
echo "hci0 not ready after ${limit}s (bthelper still pending, or hci0 not powered by bluetoothd)" >&2
exit 1
sudo chmod 755 /usr/local/bin/govee-wait-adapter
sudo systemctl add-wants bluetooth.service govee-exporter.service
sudo systemctl daemon-reload
sudo systemctl restart govee-exporterThe add-wants line looks odd but it is needed. PartOf only passes a stop or a restart of the Bluetooth service on to the exporter. With the extra dependency, a plain start of Bluetooth brings the exporter up as well.
I rebooted the Pi afterwards to see it for real. The helper waited four seconds for bthelper to finish, the scan started one second later, and all three sensors were reporting within the first minute. The watchdog did not have to step in at all.
I also keep one quick check in my pocket for the Pi:
curl -s localhost:9741/metrics | grep -c '^govee_'You are blind if the answer is zero, since no sensor has been decoded after the exporter started. With three sensors the healthy answer is 15.
Hope that helps.. Take care..